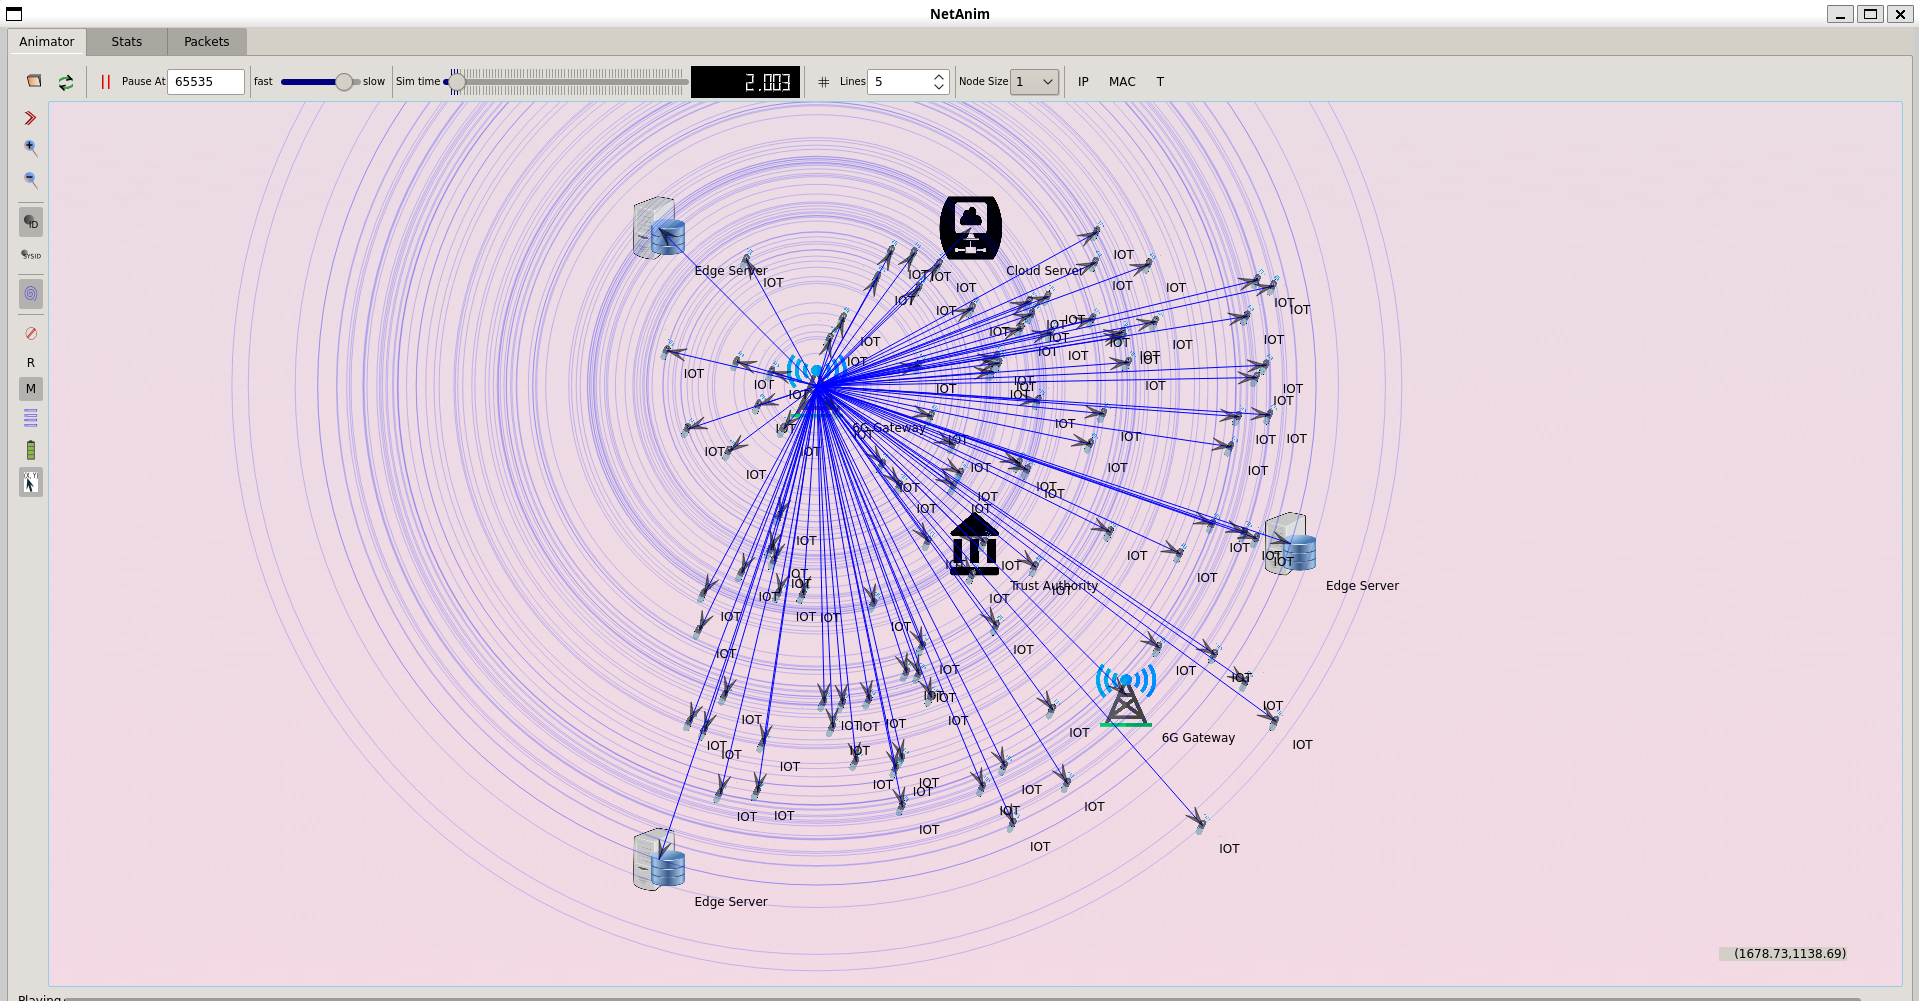
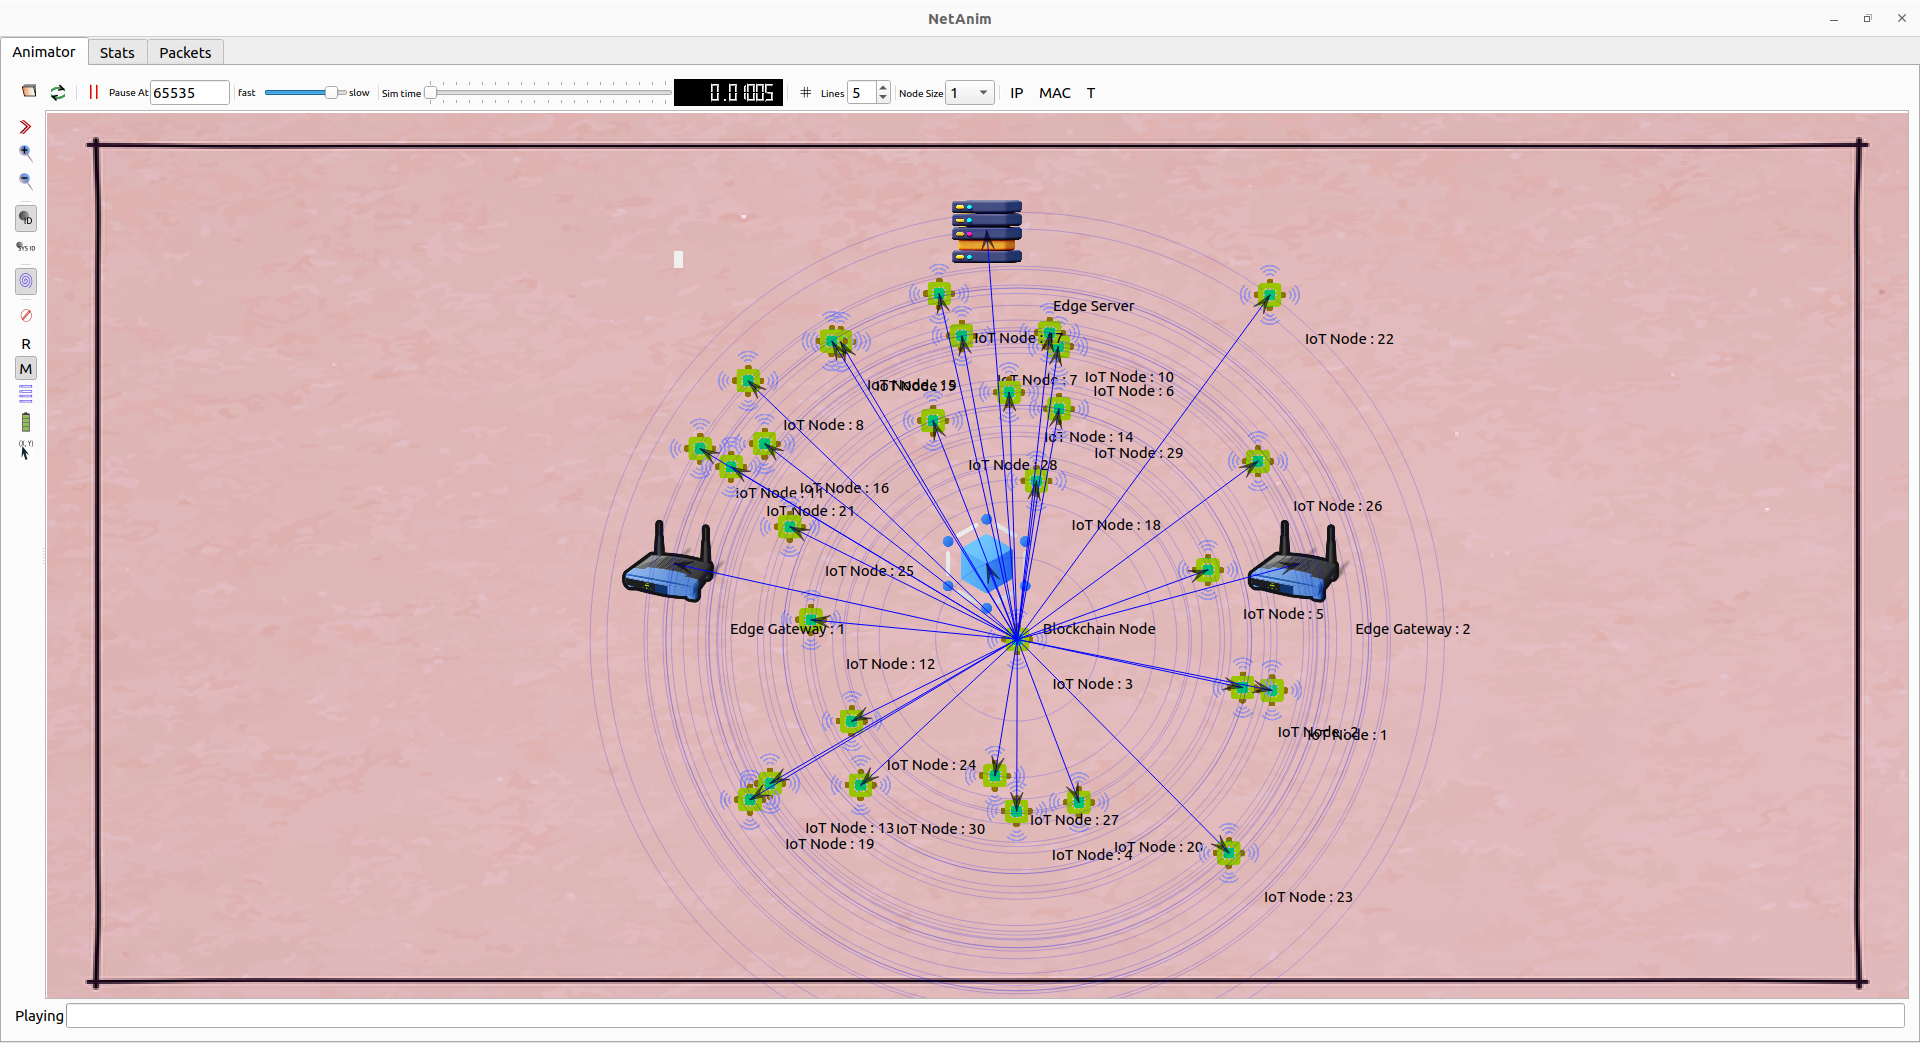
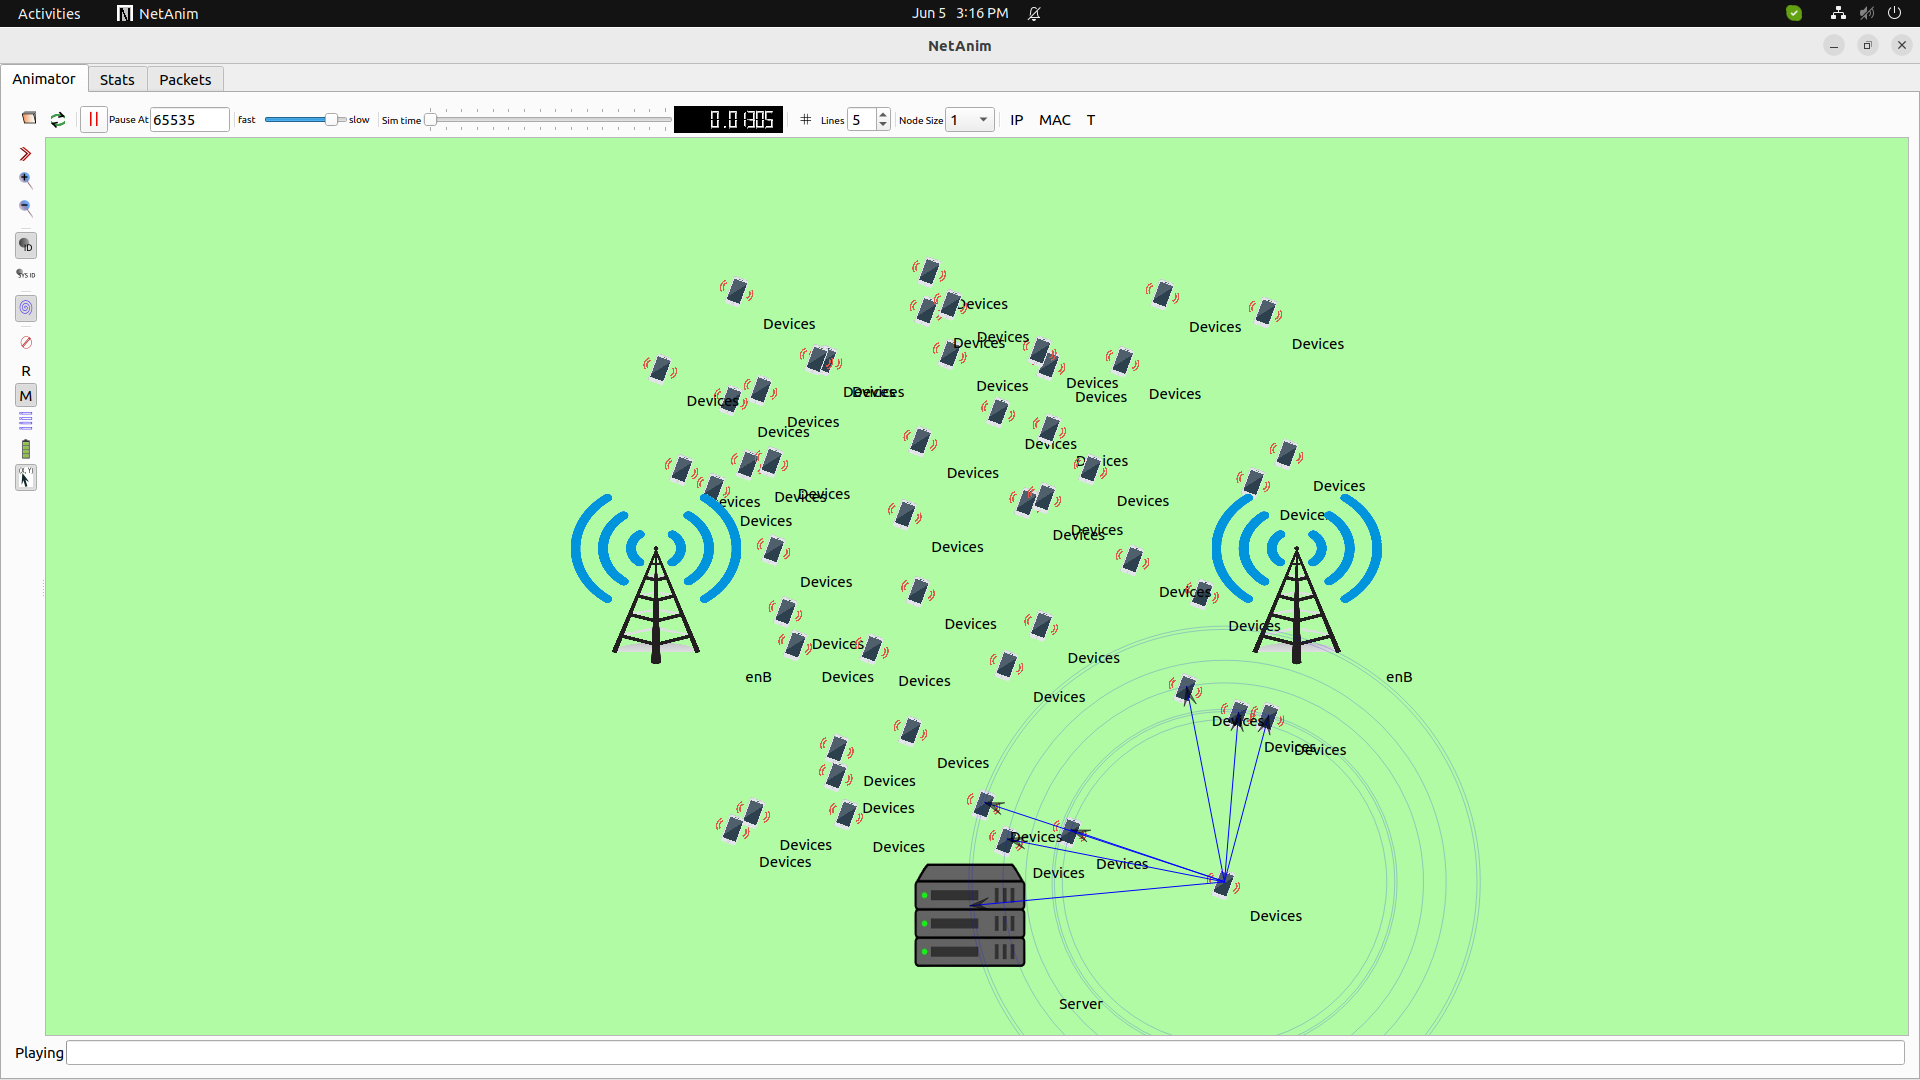
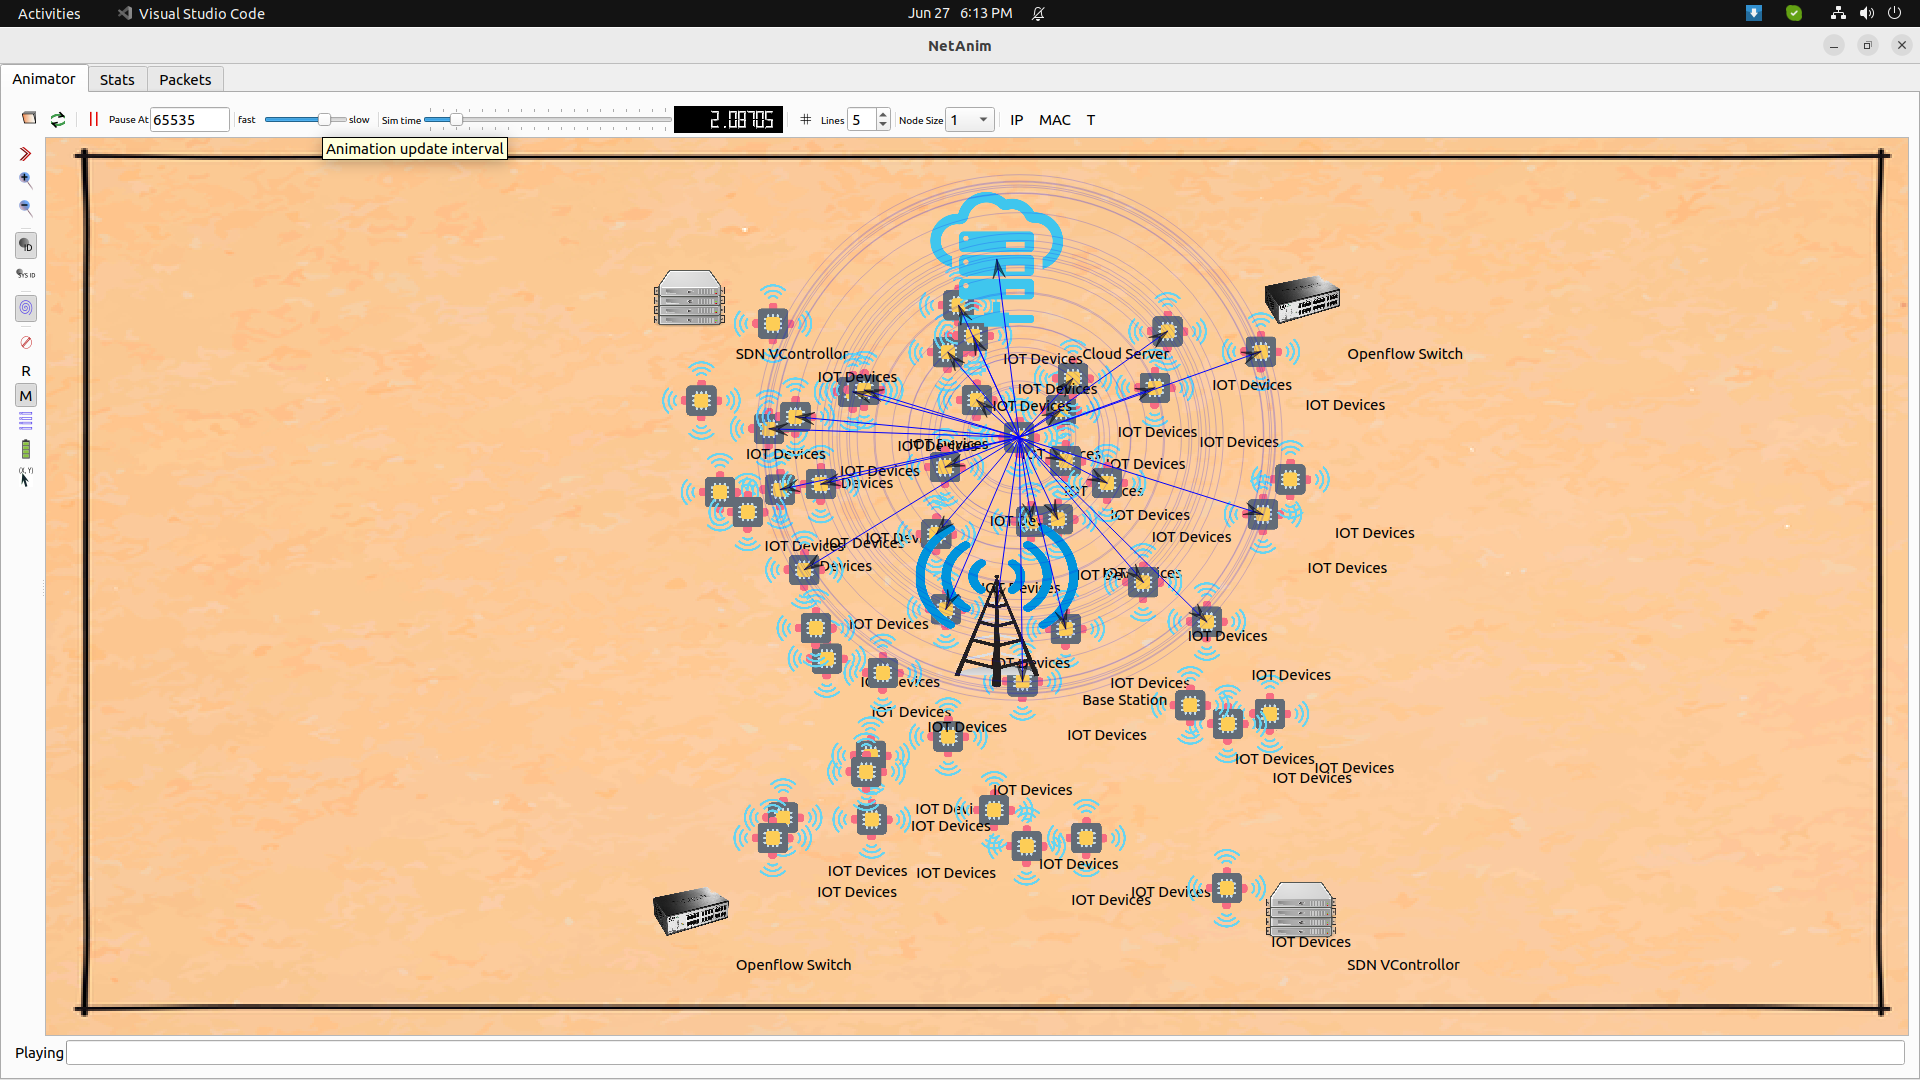
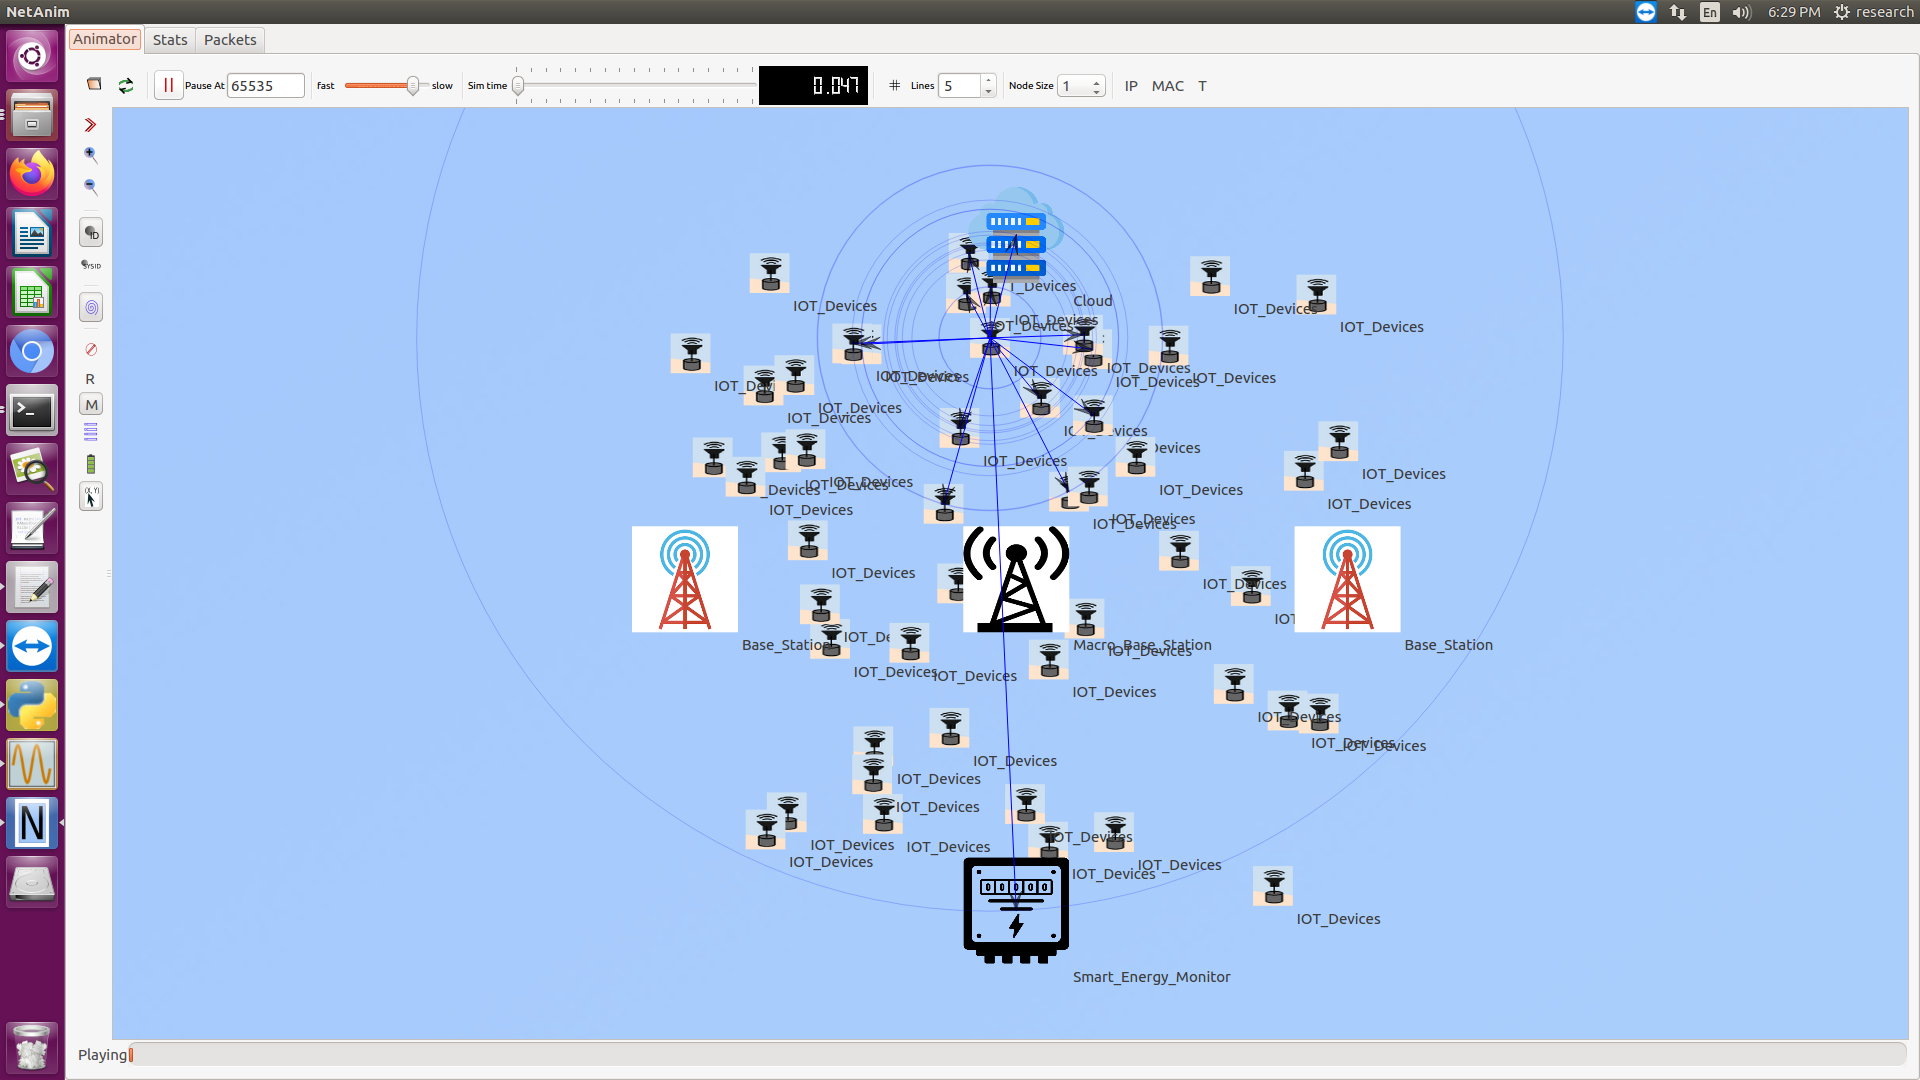
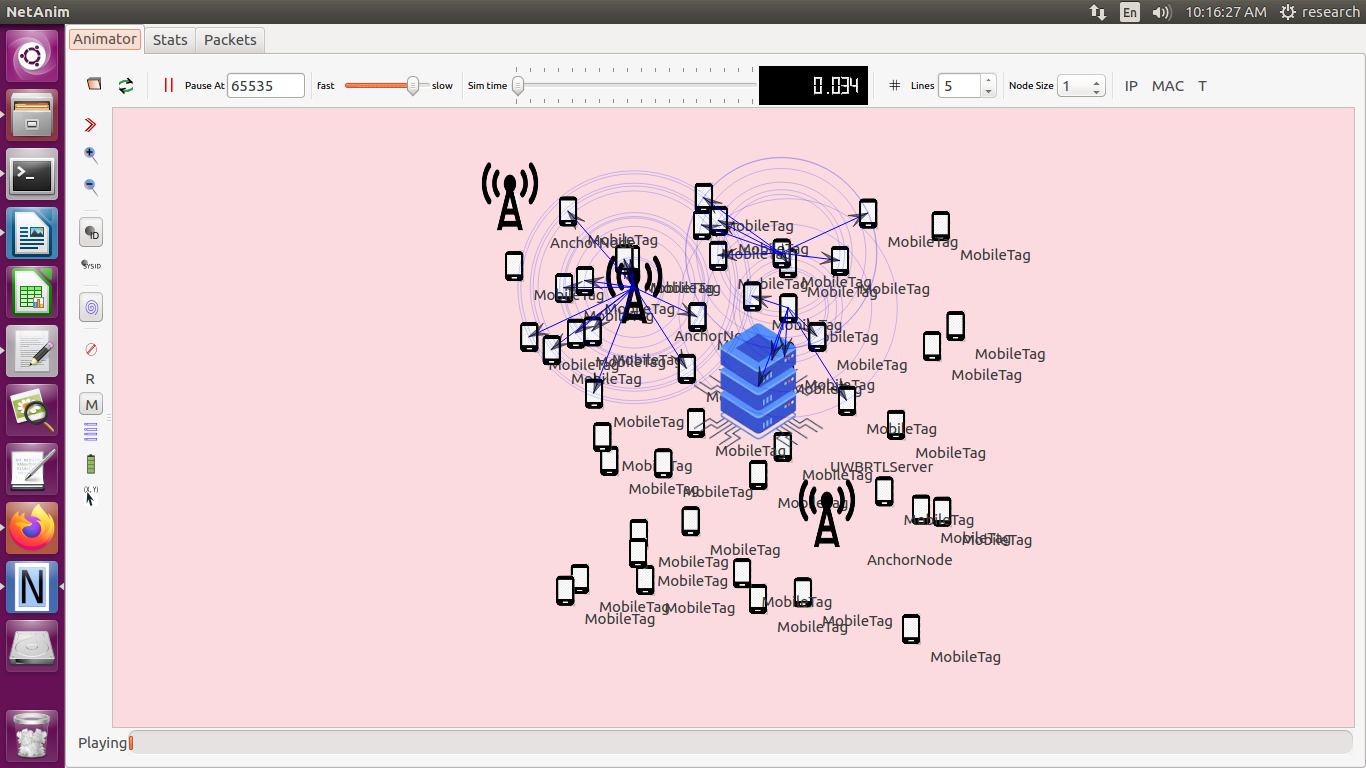
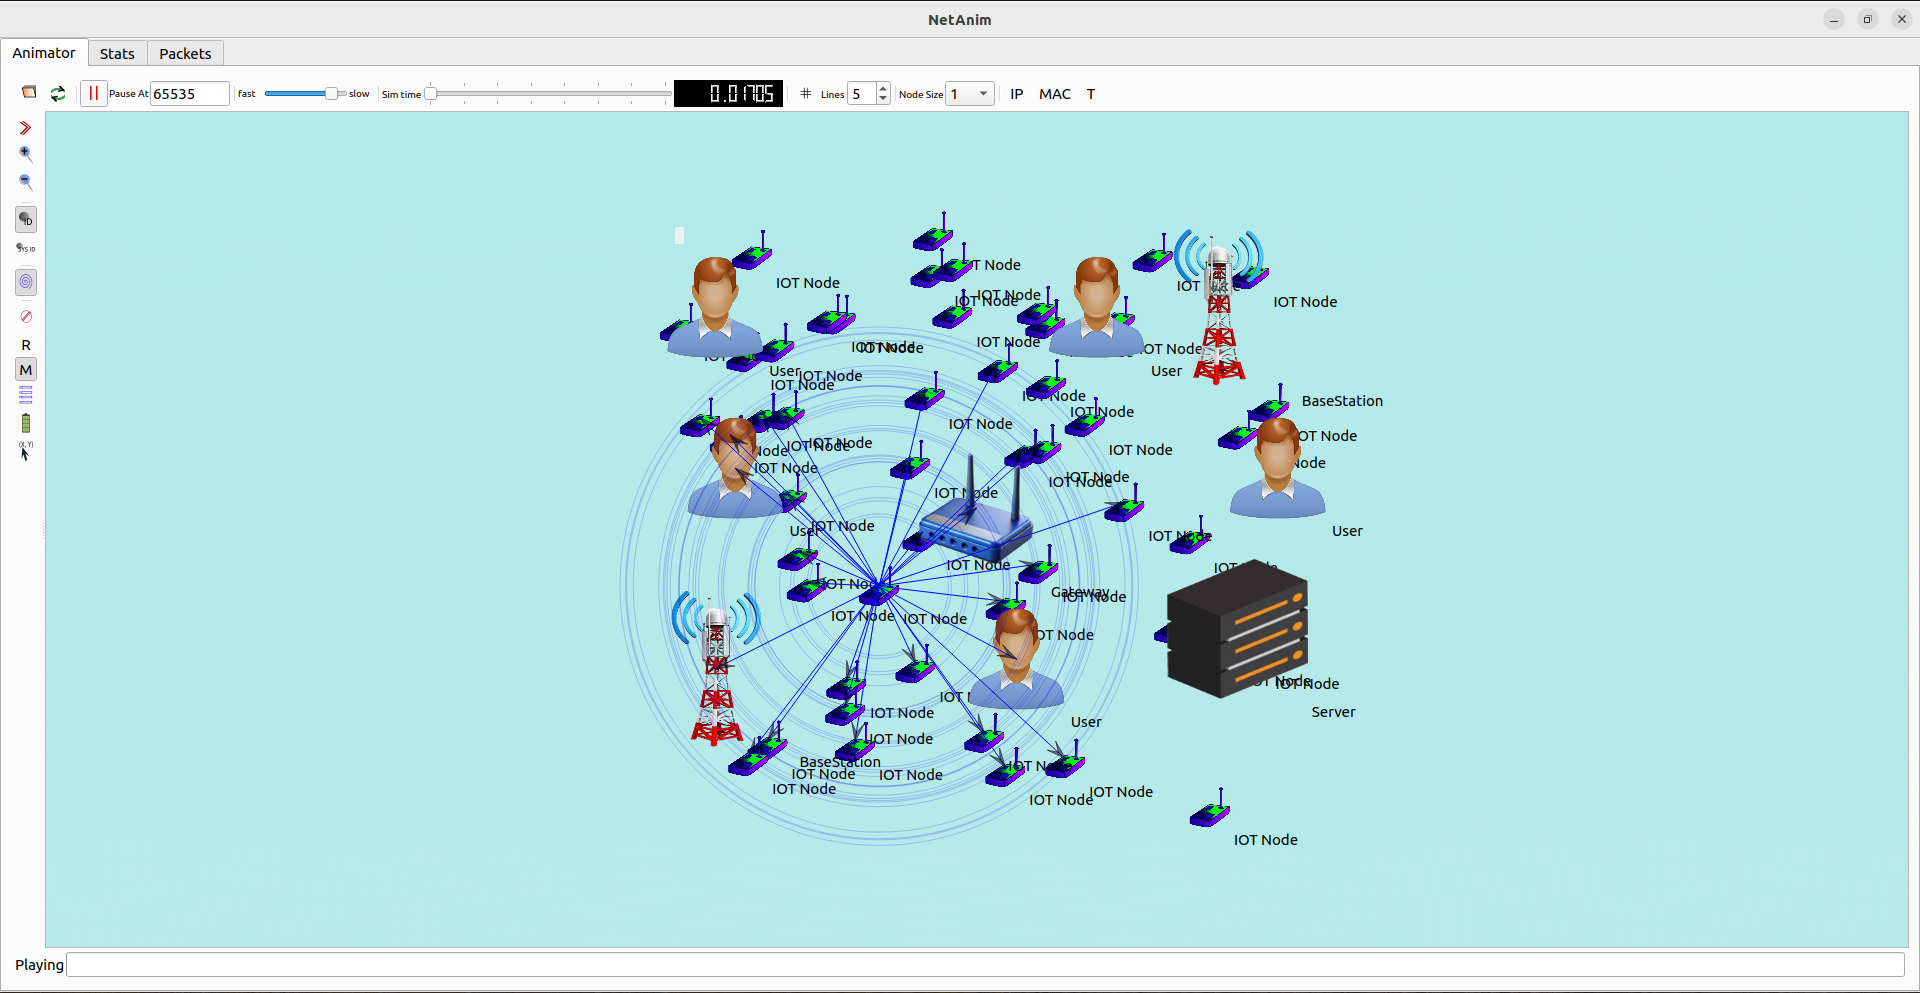
To implement the network analytics in ns3, we have to accumulate, analyze and visualize the performance data of the network. It helps us to understand the network behaviour, identifying issues and enhancing performance.
Here, we include the step-by-step implementation of network analytics in ns3:
Step-by-Step Implementation:
- Install ns3: Make sure, ns3’s latest version is installed on your computer.
- Set Up Data Collection: In the course of simulation, we can aggregate data using ns3 tracing and logging mechanisms. You can log packet transmissions, receptions, delays, losses, etc.
- Analyze Collected Data: We can use either python or other data analysis tools to process and analyze the aggregated data.
- Visualize the Results: To create graphs and charts we can use visualization libraries like Matplotlib or Seaborn which helps to understand the network performance.
Example Implementation: Analyzing Packet Delivery and Latency
- Install ns3: we have to follow the ns3 installation guide.
- Set Up Data Collection:
- Create a simple network simulation and set up tracing to aggregate data on packet delivery and latency.
#include “ns3/core-module.h”
#include “ns3/network-module.h”
#include “ns3/internet-module.h”
#include “ns3/point-to-point-module.h”
#include “ns3/applications-module.h”
using namespace ns3;
NS_LOG_COMPONENT_DEFINE(“NetworkAnalyticsExample”);
void PacketSinkRxCallback(Ptr<const Packet> packet, const Address &address) {
static uint32_t totalRxPackets = 0;
totalRxPackets++;
NS_LOG_UNCOND(“Total Received Packets: ” << totalRxPackets);
}
void TxCallback(Ptr<const Packet> packet) {
NS_LOG_UNCOND(“Packet Transmitted: ” << packet->GetUid());
}
int main(int argc, char *argv[]) {
CommandLine cmd;
cmd.Parse(argc, argv);
NodeContainer nodes;
nodes.Create(2);
PointToPointHelper pointToPoint;
pointToPoint.SetDeviceAttribute(“DataRate”, StringValue(“5Mbps”));
pointToPoint.SetChannelAttribute(“Delay”, StringValue(“2ms”));
NetDeviceContainer devices;
devices = pointToPoint.Install(nodes);
InternetStackHelper stack;
stack.Install(nodes);
Ipv4AddressHelper address;
address.SetBase(“10.1.1.0”, “255.255.255.0”);
Ipv4InterfaceContainer interfaces = address.Assign(devices);
uint16_t port = 9;
Address sinkAddress(InetSocketAddress(interfaces.GetAddress(1), port));
PacketSinkHelper packetSinkHelper(“ns3::UdpSocketFactory”, sinkAddress);
ApplicationContainer sinkApp = packetSinkHelper.Install(nodes.Get(1));
sinkApp.Start(Seconds(1.0));
sinkApp.Stop(Seconds(10.0));
Ptr<Socket> ns3UdpSocket = Socket::CreateSocket(nodes.Get(0), UdpSocketFactory::GetTypeId());
Ptr<UdpEchoClient> client = CreateObject<UdpEchoClient>();
client->SetStartTime(Seconds(2.0));
client->SetStopTime(Seconds(10.0));
ns3UdpSocket->TraceConnectWithoutContext(“Tx”, MakeCallback(&TxCallback));
sinkApp.Get(0)->TraceConnectWithoutContext(“Rx”, MakeCallback(&PacketSinkRxCallback));
Simulator::Run();
Simulator::Destroy();
return 0;
}
Run the Simulation and Collect Data: For the transmission of packets and their reception, we have to generate log data by running the simulation script.
Analyze Collected Data: To analyze the accumulated data, we can use python script.
# analyze_logs.py
import matplotlib.pyplot as plt
# Read log data from a file
with open(‘ns-3-log-file.txt’) as f:
log_data = f.readlines()
tx_times = []
rx_times = []
for line in log_data:
if “Packet Transmitted” in line:
parts = line.split()
packet_id = parts[3]
tx_times.append((packet_id, float(parts[0])))
elif “Total Received Packets” in line:
parts = line.split()
packet_id = parts[3]
rx_times.append((packet_id, float(parts[0])))
# Calculate latencies
latencies = []
for tx in tx_times:
for rx in rx_times:
if tx[0] == rx[0]:
latencies.append(rx[1] – tx[1])
# Plot latencies
plt.hist(latencies, bins=20)
plt.xlabel(‘Latency (s)’)
plt.ylabel(‘Frequency’)
plt.title(‘Packet Latency Distribution’)
plt.show()
Visualize the Results:
- Use Matplotlib to visualize the latency distribution.
import matplotlib.pyplot as plt
# Example data
latencies = [0.1, 0.15, 0.2, 0.3, 0.1, 0.25, 0.4, 0.35, 0.15]
# Plot latencies
plt.hist(latencies, bins=20)
plt.xlabel(‘Latency (s)’)
plt.ylabel(‘Frequency’)
plt.title(‘Packet Latency Distribution’)
plt.show()
Through this script, we have successfully learned how to implement network analytics in ns3 tool and if you need any added information of the network analytics, we will provide them too.
ns3simulation.com is the top choice for comparative analysis and support in Network Analytics using ns3tool. You can contact us for help. Our developers share popular project ideas with innovative work.


