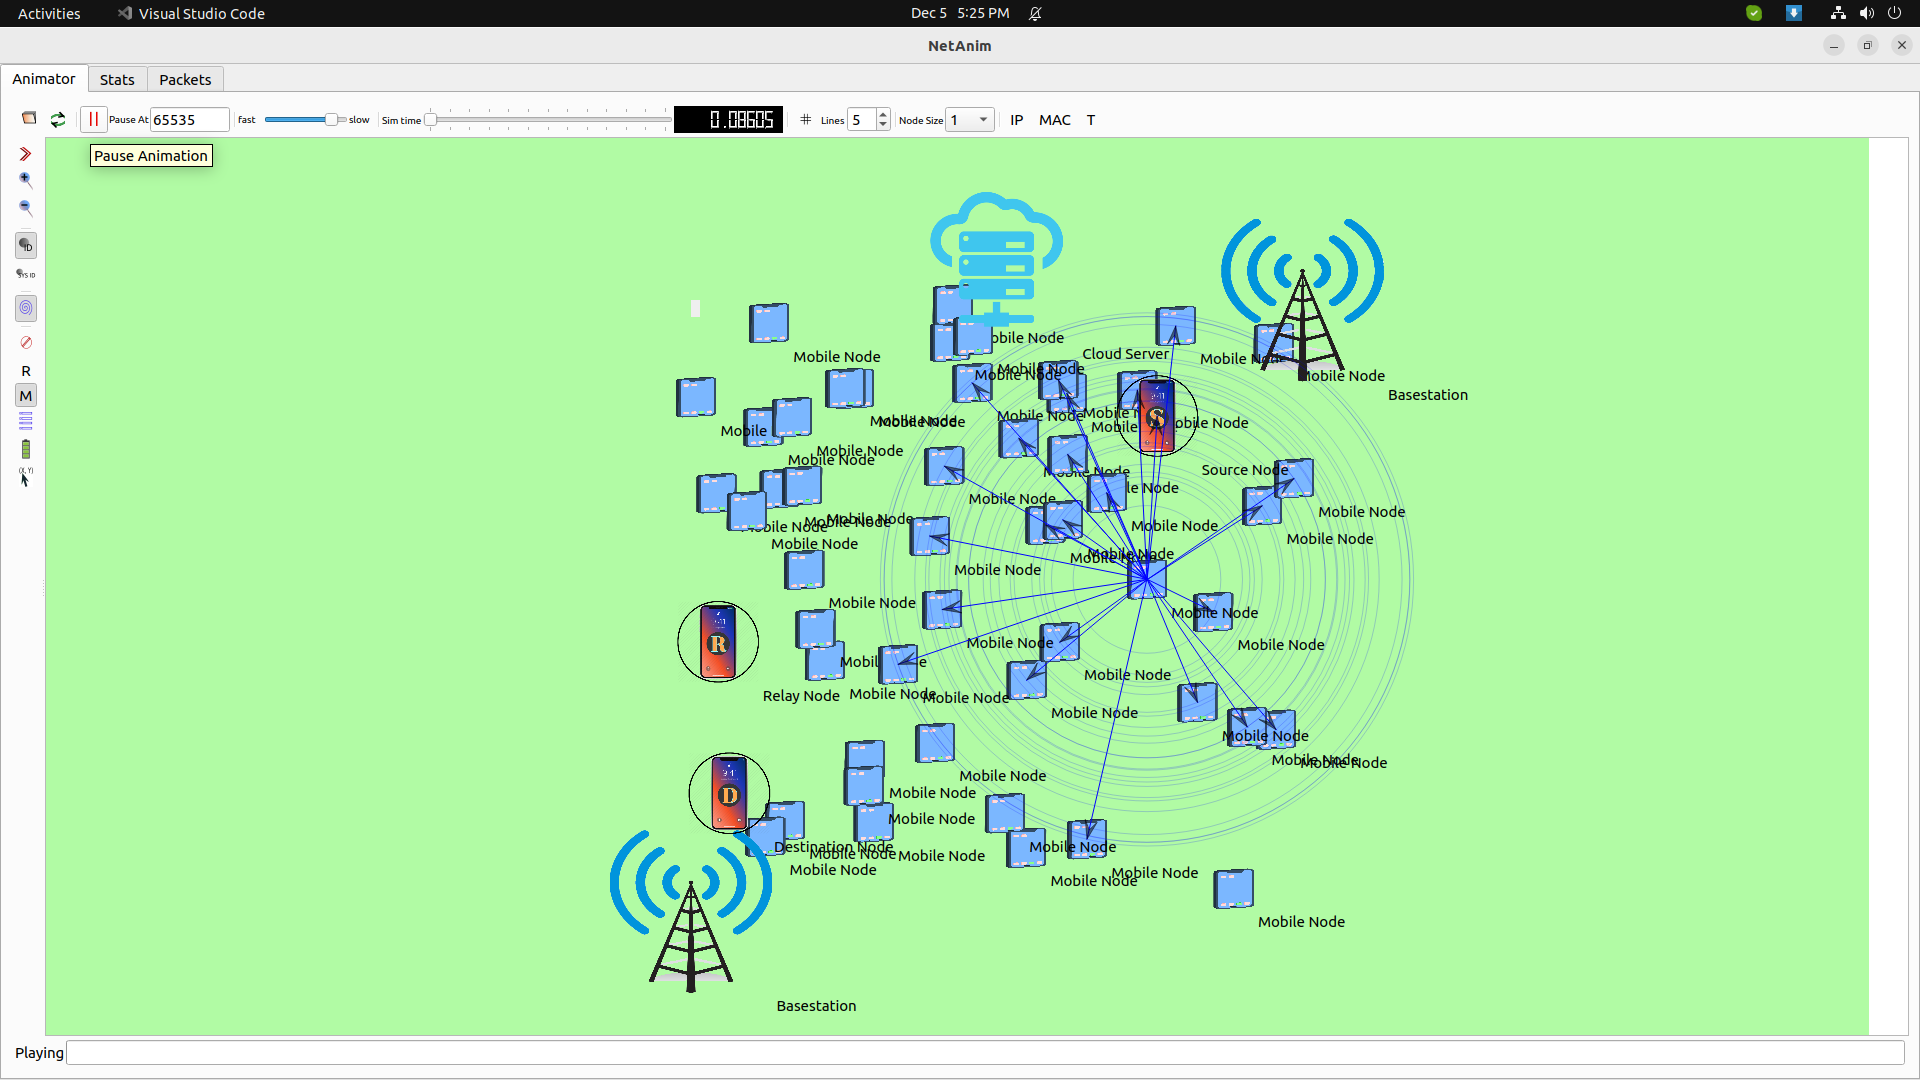
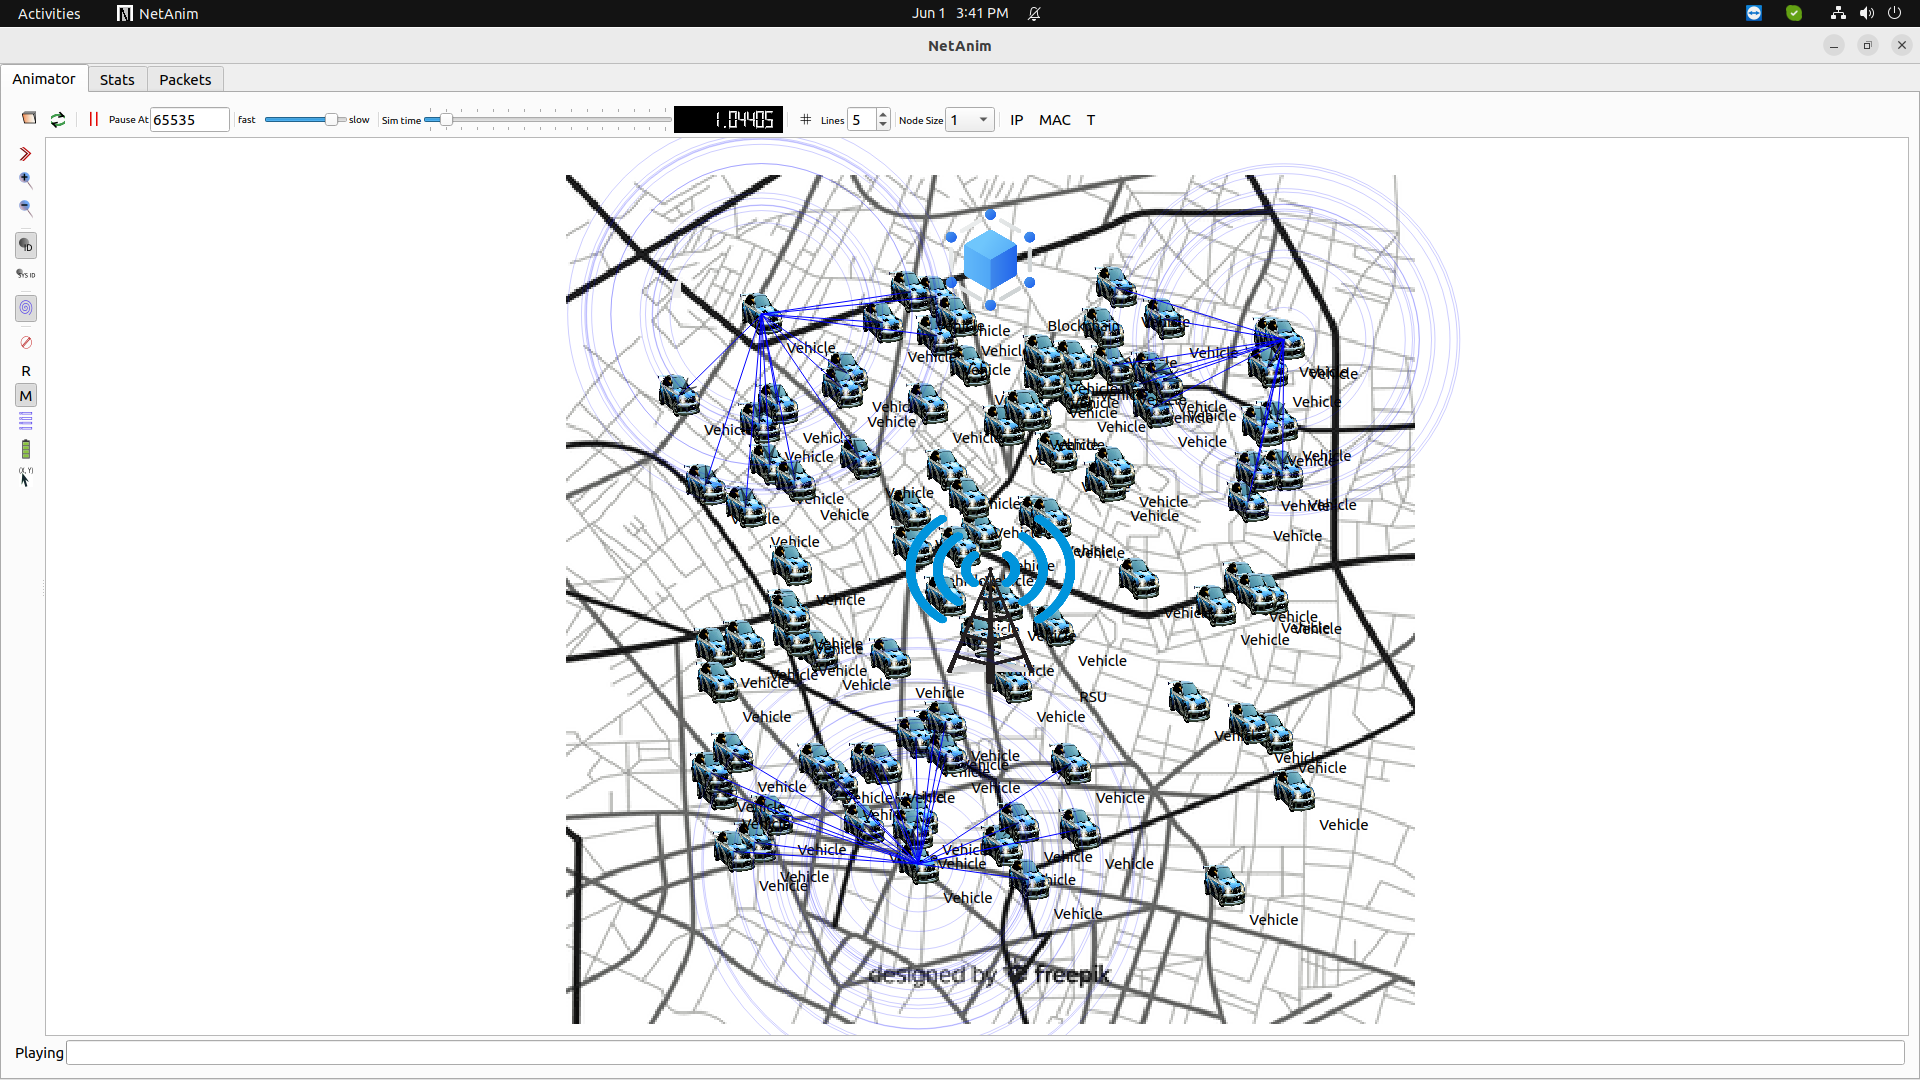
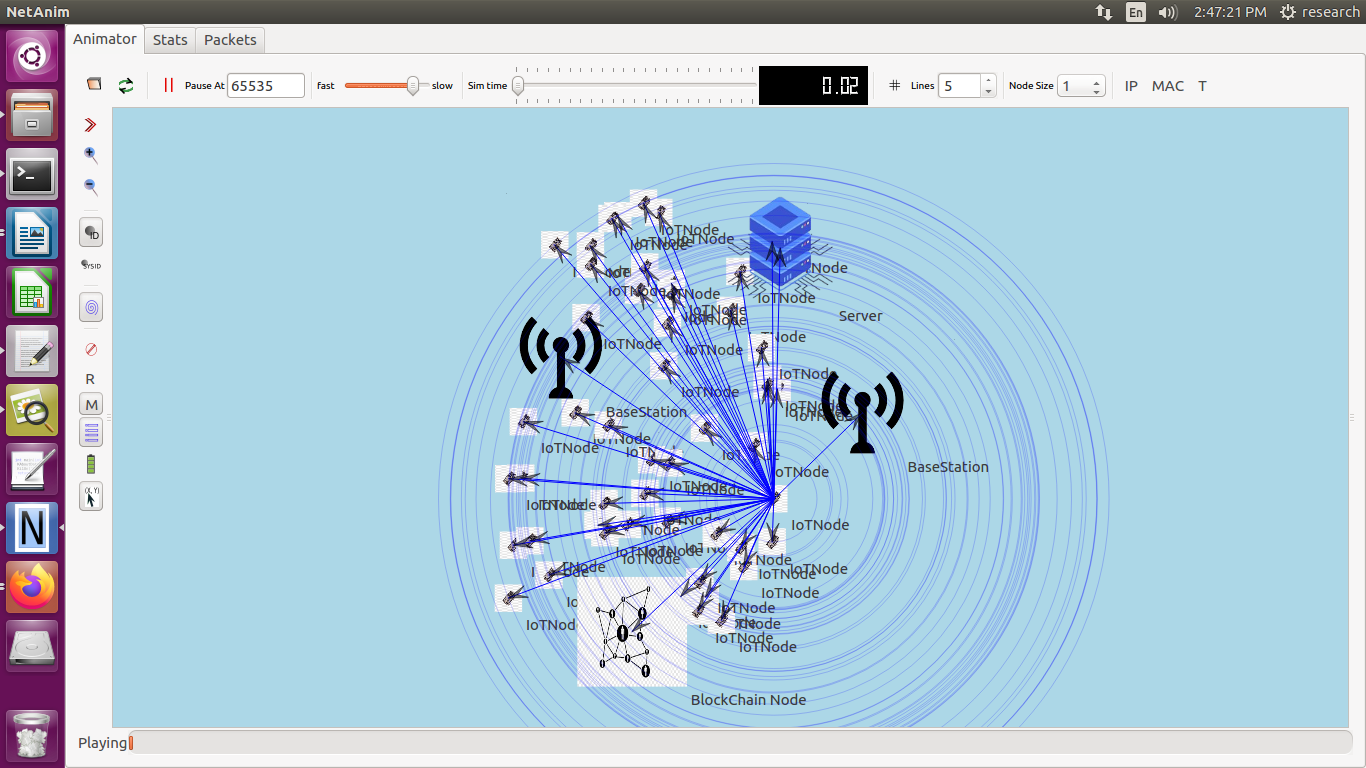
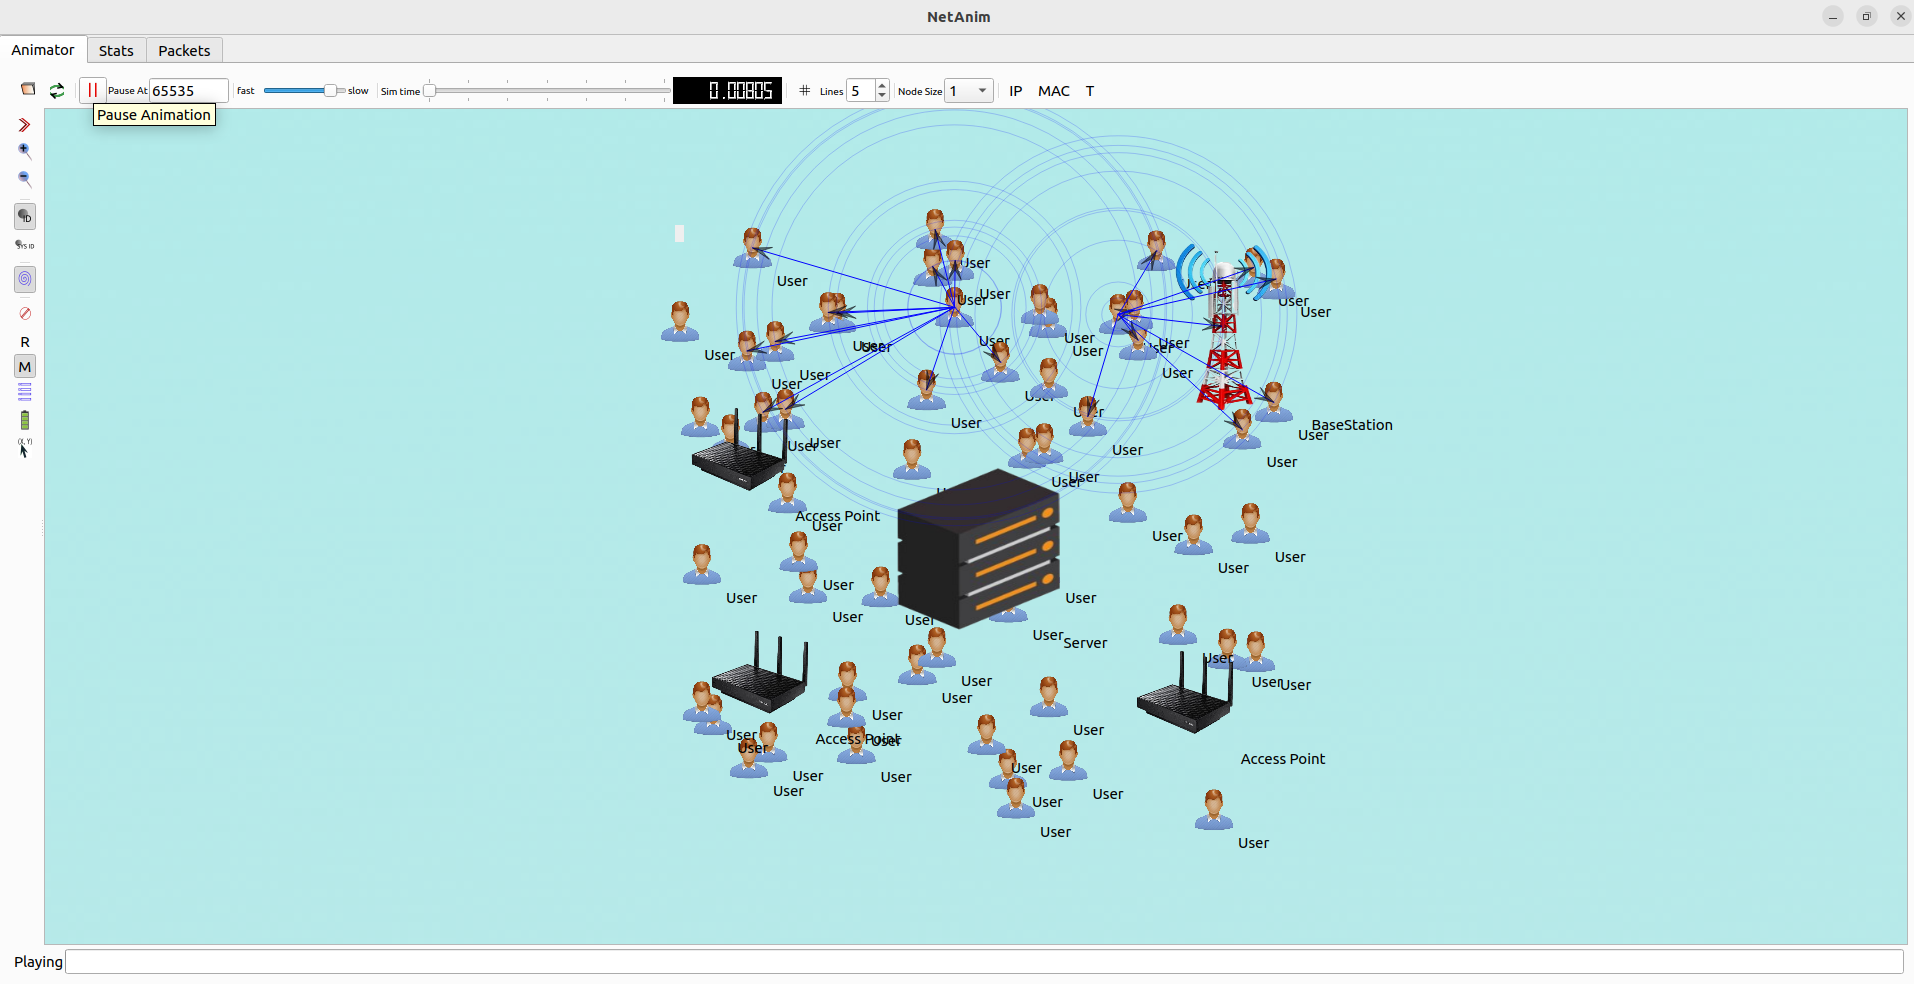
To calculate the Network Packet analysis in ns3, needs to gather and observes the data on packet transmission, receptions, losses, and delays throughout the network simulation. This includes the parameters like throughput, packet delivery ratio (PDR), latency, and jitter.
We also deliver detailed information on how to calculate Network Packet Analysis in ns3simulation. Get optimal Network Packet results, from ns3simulation.com.
Here we provide the detailed procedure to analyse the packet in ns3:
- Set up Your Simulation Environment: Create a network topology; configure nodes, links, and protocols.
- Install Applications: Set up applications on the nodes to generate and receive traffic.
- Trace the Packets: Use ns3 tracing capabilities to record packet events.
- Analyze the Data: Parse the trace files to extract relevant data and perform calculations.
Example: Simple Network Packet Analysis
In this place, we generate the network topology with 2 nodes that links by a point to point link and analyse the packet in network.
Step 1: Set Up Your Simulation Environment
#include “ns3/core-module.h”
#include “ns3/network-module.h”
#include “ns3/internet-module.h”
#include “ns3/point-to-point-module.h”
#include “ns3/applications-module.h”
using namespace ns3;
NS_LOG_COMPONENT_DEFINE (“NetworkPacketAnalysisExample”);
void PacketSent (Ptr<const Packet> packet)
{
NS_LOG_UNCOND (“Packet sent at time ” << Simulator::Now ().GetSeconds ());
}
void PacketReceived (Ptr<const Packet> packet)
{
NS_LOG_UNCOND (“Packet received at time ” << Simulator::Now ().GetSeconds ());
}
int main (int argc, char *argv[])
{
// Create two nodes
NodeContainer nodes;
nodes.Create (2);
// Set up the point-to-point link
PointToPointHelper pointToPoint;
pointToPoint.SetDeviceAttribute (“DataRate”, StringValue (“5Mbps”));
pointToPoint.SetChannelAttribute (“Delay”, StringValue (“2ms”));
// Install the link devices on the nodes
NetDeviceContainer devices;
devices = pointToPoint.Install (nodes);
// Install the internet stack
InternetStackHelper stack;
stack.Install (nodes);
// Assign IP addresses
Ipv4AddressHelper address;
address.SetBase (“10.1.1.0”, “255.255.255.0”);
Ipv4InterfaceContainer interfaces = address.Assign (devices);
// Set up the UDP echo server on Node 1
uint16_t port = 9; // well-known echo port number
UdpEchoServerHelper echoServer (port);
ApplicationContainer serverApps = echoServer.Install (nodes.Get (1));
serverApps.Start (Seconds (1.0));
serverApps.Stop (Seconds (10.0));
// Set up the UDP echo client on Node 0
UdpEchoClientHelper echoClient (interfaces.GetAddress (1), port);
echoClient.SetAttribute (“MaxPackets”, UintegerValue (100));
echoClient.SetAttribute (“Interval”, TimeValue (Seconds (0.1))); // 10 packets per second
echoClient.SetAttribute (“PacketSize”, UintegerValue (1024));
ApplicationContainer clientApps = echoClient.Install (nodes.Get (0));
clientApps.Start (Seconds (2.0));
clientApps.Stop (Seconds (10.0));
// Enable tracing
devices.Get (0)->TraceConnectWithoutContext (“MacTx”, MakeCallback (&PacketSent));
devices.Get (1)->TraceConnectWithoutContext (“MacRx”, MakeCallback (&PacketReceived));
// Run the simulation
Simulator::Run ();
Simulator::Destroy ();
return 0;
}
Step 2: Install Applications
In this example, a UDP echo server is installed on Node 1, and a UDP echo client is installed on Node 0. The client sends 100 packets, each 1024 bytes in size, at an interval of 0.1 seconds.
Step 3: Trace the Packets
Packet transmission and reception are traced using callbacks. The PacketSent and PacketReceived functions are used to log the event times.
Step 4: Analyse the Data
You can use a script to parse the logged data and calculate various network metrics. Here’s an example of how to calculate throughput, PDR, latency, and jitter.
Example Python Script for Network Packet Analysis
Here, we had given the sample python snippet for network packet analysis:
import re
send_times = []
receive_times = []
# Regular expressions to match the log output
send_pattern = re.compile(r”Packet sent at time (\d+\.\d+)”)
receive_pattern = re.compile(r”Packet received at time (\d+\.\d+)”)
# Parse the log file
with open(“ns3-output.log”, “r”) as log_file:
for line in log_file:
send_match = send_pattern.search(line)
receive_match = receive_pattern.search(line)
if send_match:
send_times.append(float(send_match.group(1)))
if receive_match:
receive_times.append(float(receive_match.group(1)))
# Calculate Packet Delivery Ratio (PDR)
sent_packets = len(send_times)
received_packets = len(receive_times)
pdr = (received_packets / sent_packets) * 100 if sent_packets > 0 else 0
# Calculate Throughput (in bits per second)
packet_size = 1024 * 8 # packet size in bits
simulation_time = 10 – 2 # simulation time in seconds (from 2s to 10s)
throughput = (received_packets * packet_size) / simulation_time
# Calculate Latency
latencies = [recv – send for send, recv in zip(send_times, receive_times)]
average_latency = sum(latencies) / len(latencies) if latencies else 0
# Calculate Jitter
jitters = [abs(latencies[i] – latencies[i-1]) for i in range(1, len(latencies))]
average_jitter = sum(jitters) / len(jitters) if jitters else 0
print(f”Packet Delivery Ratio (PDR): {pdr}%”)
print(f”Throughput: {throughput} bps”)
print(f”Average Latency: {average_latency} seconds”)
print(f”Average Jitter: {average_jitter} seconds”)
Explanation
Here, we explained the process for network packet analysis:
- Set up Your Simulation Environment: Create two nodes and connect them with a point-to-point link.
- Install Applications: Install a UDP echo server on Node 1 and a UDP echo client on Node 0. Configure the client to send a specified number of packets at a specified interval.
- Trace the Packets: Use callbacks to log the times when packets are sent and received.
- Analyze the Data: Parse the log file to extract send and receive times, then calculate PDR, throughput, latency, and jitter using the extracted data.
In the conclusion the network packet analysis has creates the topology and then it analyse the packets and computed the calculation. If you want to learn about how the network packet analysis works and performs in other alternative tools that also provided here.
Our developers offer direction on network performance for your current project. As well, we are steering an in-depth performance analysis.


