Gnuplot is a powerful tool that our team has all the necessary resources for. It is commonly used for plotting and visualizing data through the command line. It can create different types of plots, like 2D and 3D, and save them in formats like PNG, PDF, SVG, and LaTeX. This tool is highly favored in scientific and engineering fields for its efficiency in generating top-notch plots from data files or mathematical equations. It is highly customizable, allowing users to control every aspect of the plot, from axes labels and titles to line styles and colors. gnuplot also supports scripting, enabling users to automate the creation of plots and incorporate them into larger workflows. Gnuplot allows us to easily visualize data, which helps them analyze trends, showcase their findings, and share complex information more clearly.
We have popped out the installation of Gnuplot programming.
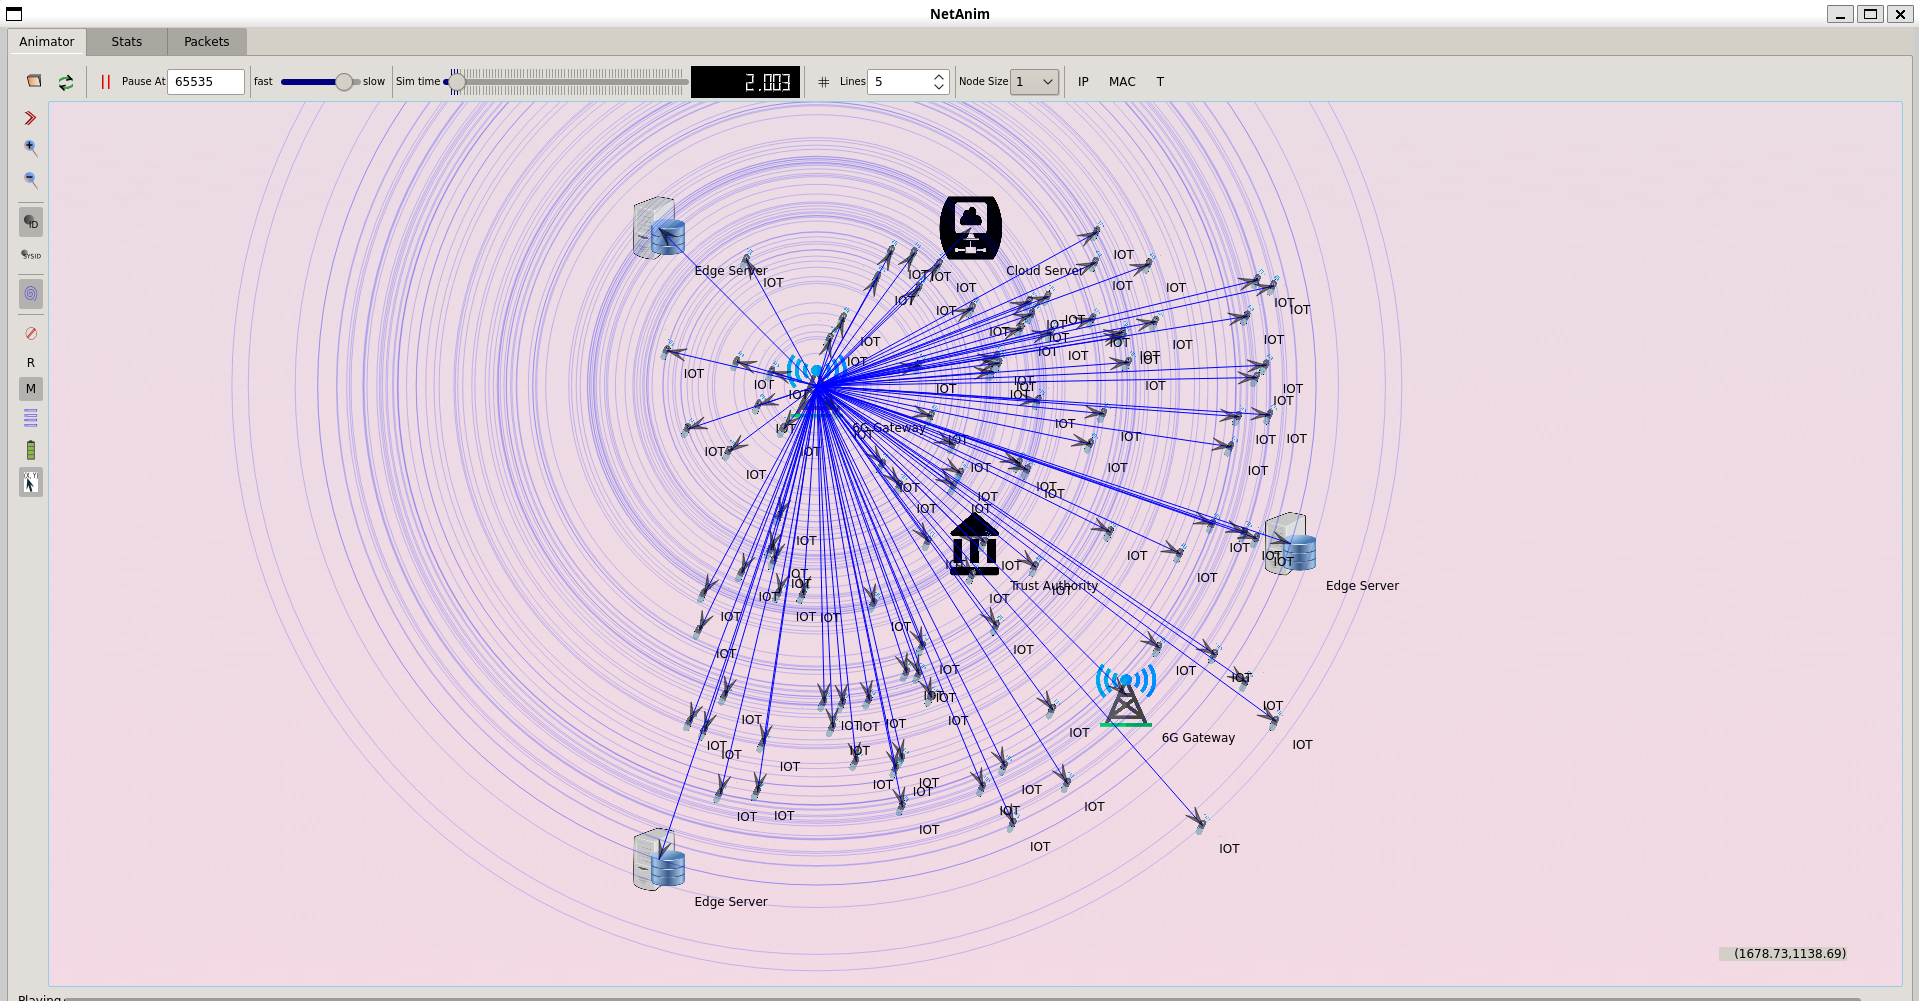
Screenshot:
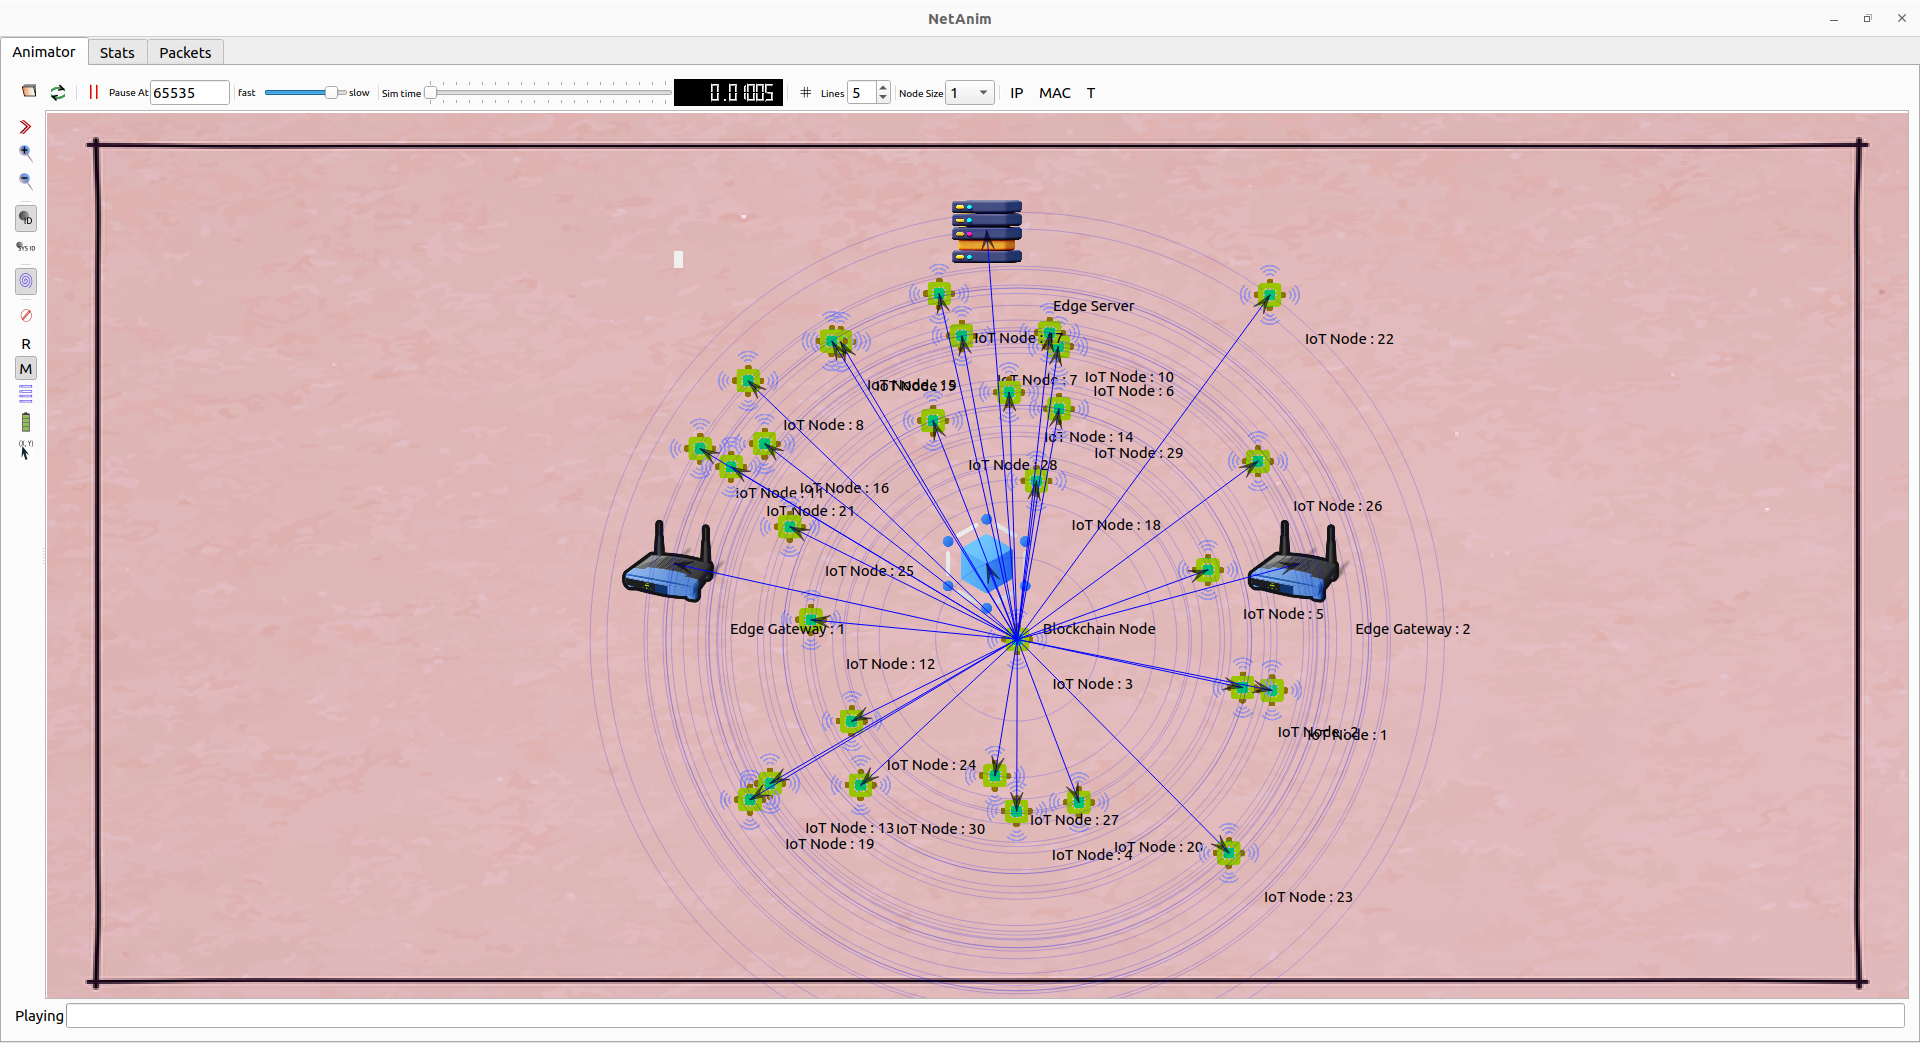
Screenshot:
2.System File Update Command:
First of all, we need to updates the list of available packages and their versions stored in the system’s package index. Use below command to update the system package.
Command: “sudo apt-get update”
Screenshot:
3.Gnuplot Installation Command:
Next, we need to install Gnuplot package in the ubuntu system. Use below command to install the Gnuplot package.
Command: “sudo apt-get install gnuplot”
Screenshot:
If it prompt, then Click Y to install the additional package.
Screenshot:
Gnuplot package Installed successfully in the Ubuntu 22.04 system.
So if you face any difficulties in installing after referring to this page then reach us out for more help.


We Provide
We Provide

 Helping 1M+ Research Scholars
| Research Topics | Project | Paper | Thesis |
|---|---|---|---|
| 3D Underwater WSN | 150 | 499 | 541 |
| Hybrid Beamforming | 110 | 398 | 432 |
| Intelligent Agent WSN | 135 | 412 | 510 |
| Blockchain technology | 121 | 467 | 496 |
| Optical Networks | 149 | 398 | 465 |
| Vehicular sensor Network | 250 | 491 | 534 |
| Industrial IoT | 114 | 378 | 431 |
| Service Discovery | 170 | 419 | 489 |
| Named Data Networking | 121 | 386 | 423 |
| SDN-NDN | 110 | 427 | 498 |
| D2D Communication | 131 | 389 | 425 |
| M2M Communication | 108 | 389 | 411 |
| UWB communication | 124 | 495 | 510 |
| 5G Network Slicing | 137 | 437 | 492 |
| Delay Tolerant Network | 105 | 469 | 533 |
| Multi-Microgrid | 111 | 326 | 379 |
| Content-centric network | 100 | 296 | 304 |
| 5G Beyond networks | 131 | 379 | 409 |
| Cloud-RAN | 127 | 352 | 389 |
| Fog-RAN | 145 | 310 | 378 |
| FANET | 178 | 395 | 400 |
| Cognitive adhoc network | 153 | 325 | 363 |
| Vehicular NDN | 175 | 310 | 425 |
| Multimedia sensor network | 205 | 275 | 315 |
| V2X communication | 151 | 200 | 308 |
| Software-defined WSN | 176 | 248 | 358 |
| 5G | 201 | 289 | 365 |
| Fibre Channel / Cellular / 5G topics | — | — | — |
| Cellular Networks | 185 | 235 | 397 |
| CRN | 204 | 268 | 348 |
| IoT | 163 | 287 | 395 |
| Intrusion Detection system | 110 | 257 | 348 |
| LiFi | 101 | 279 | 386 |
| LTE | 159 | 208 | 345 |
| MANET | 175 | 247 | 395 |
| MIMO | 142 | 298 | 354 |
| Mobile Computing | 114 | 254 | 308 |
| RPL | 189 | 275 | 357 |
| SDN | 109 | 258 | 346 |
| VANET | 152 | 278 | 359 |
| Vertical Handover | 108 | 241 | 367 |
| Wireless Body Area Network | 121 | 198 | 348 |
| Wireless Communication | 178 | 248 | 371 |
| Wireless Sensor Networks | 106 | 213 | 369 |

From Topic selection to Final submission support.
Fix build errors, runtime issues, and simulation crashes.
Create real-time research-based network scenarios.
Improve simulation efficiency and execution time.
Help with result interpretation, graphs, and documentation.
Project explanation for viva, review, and presentations.
Your one-stop solution for NS-3 protocols, routing strategies, and parameter optimization—fully tailored to your research needs.

4.8 rating on Google*
Copyright © 2026 Ns3Simulation, All Rights Reserved